Note
Go to the end to download the full example code
K-means Clustering
CR-Sparse includes a K-means implementation as part of its sparse subspace clustering module.
Configure JAX to work with 64-bit floating point precision.
from jax.config import config
config.update("jax_enable_x64", True)
Let’s import necessary libraries
from jax import random
import jax.numpy as jnp
import cr.sparse as crs
# vector quantization
import cr.sparse.cluster.vq as vq
# Plotting
import matplotlib.pyplot as plt
# Some PRNGKeys for later use
key = random.PRNGKey(0)
keys = random.split(key, 10)
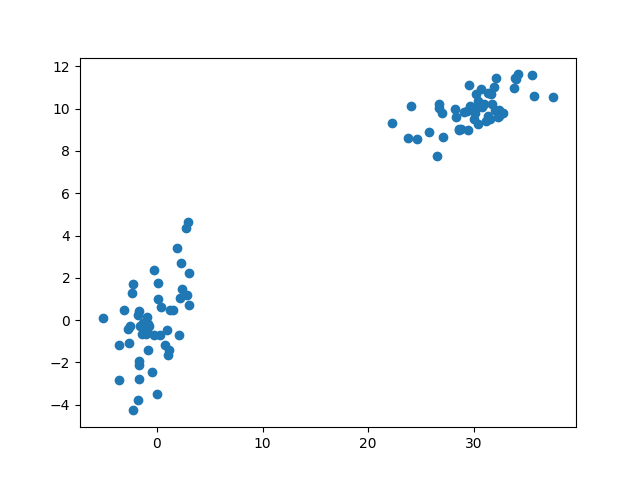
Prepare sample data
# Number of points for each cluster
pts = 50
# Mean vector for first cluster
mu_a = jnp.array([0, 0])
# Covariance matrix for first cluster
cov_a = jnp.array([[4, 1], [1, 4]])
# Sampled points for the first cluster
a = random.multivariate_normal(keys[0], mu_a, cov_a, shape=(pts,))
# Mean vector for second cluster
mu_b = jnp.array([30, 10])
# Covariance matrix for second cluster
cov_b = jnp.array([[10, 2], [2, 1]])
# Sampled points for the second cluster
b = random.multivariate_normal(keys[1], mu_b, cov_b, shape=(pts,))
# combined points
features = jnp.concatenate((a, b))
# plot the points
plt.scatter(features[:, 0], features[:, 1])
<matplotlib.collections.PathCollection object at 0x7f27aaa67700>
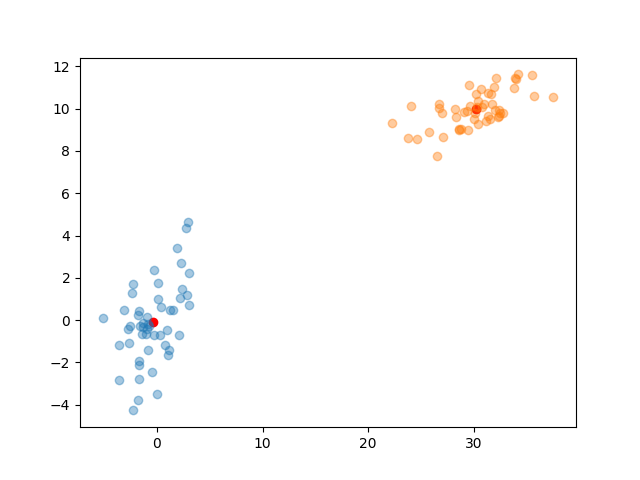
K-means clustering
# number of clusters
k=2
# Perform K-means clustering
result = vq.kmeans_jit(keys[3], features, k)
centroids = result.centroids
assignment = result.assignment
for i in range(k):
    # points for the k-th cluster
    cluster = features[assignment == i]
    plt.plot(cluster[:,0], cluster[:,1], "o", alpha=0.4)
# plot the centroids
plt.scatter(centroids[:, 0], centroids[:, 1], c='r')
<matplotlib.collections.PathCollection object at 0x7f27aa3b2f70>
Let’s print the assignment to verify that points have indeed been assigned to respective clusters
print(assignment)
[0 0 0 0 0 0 0 0 0 0 0 0 0 0 0 0 0 0 0 0 0 0 0 0 0 0 0 0 0 0 0 0 0 0 0 0 0
 0 0 0 0 0 0 0 0 0 0 0 0 0 1 1 1 1 1 1 1 1 1 1 1 1 1 1 1 1 1 1 1 1 1 1 1 1
 1 1 1 1 1 1 1 1 1 1 1 1 1 1 1 1 1 1 1 1 1 1 1 1 1 1]
Let’s print the number of points for each cluster
print(vq.assignment_counts(assignment, k))
[[50]
 [50]]
Let’s print the number of iterations taken to converge
print(result.iterations)
2
If we have points and centroids, we can compute the assignments
assignment, distances = vq.find_assignment_jit(features, centroids)
print(assignment)
[0 0 0 0 0 0 0 0 0 0 0 0 0 0 0 0 0 0 0 0 0 0 0 0 0 0 0 0 0 0 0 0 0 0 0 0 0
 0 0 0 0 0 0 0 0 0 0 0 0 0 1 1 1 1 1 1 1 1 1 1 1 1 1 1 1 1 1 1 1 1 1 1 1 1
 1 1 1 1 1 1 1 1 1 1 1 1 1 1 1 1 1 1 1 1 1 1 1 1 1 1]
For any new point, it is easy to find the index of nearest centroid
pt = jnp.array([1, 4])
idx = vq.find_nearest_jit(pt, centroids)
print(centroids[idx])
[-0.39618243 -0.09914168]
Total running time of the script: (0 minutes 1.910 seconds)
